

This Market Update is written by our Capital Market specialists each week to bring you insight into what's happening in the market and how it may affect mortgage rates and real estate trends.
Market Commentary:
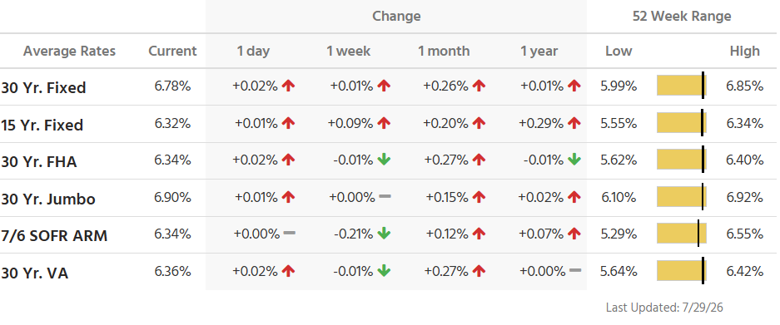
Mortgage rates reached near one-year highs between July 24 and July 30, 2026, driven by rising 10-year Treasury yields, energy inflation, and a hawkish Federal Reserve stance that pushed 30-year fixed rates toward the 6.76% range. This surge caused a 6.4% slump in weekly mortgage applications, forcing real estate professionals to rely on builder price cuts, seller concessions, and rate buydowns to sustain buyer affordability.
There are several deeper macroeconomic shifts and market metrics from the week worth noting:
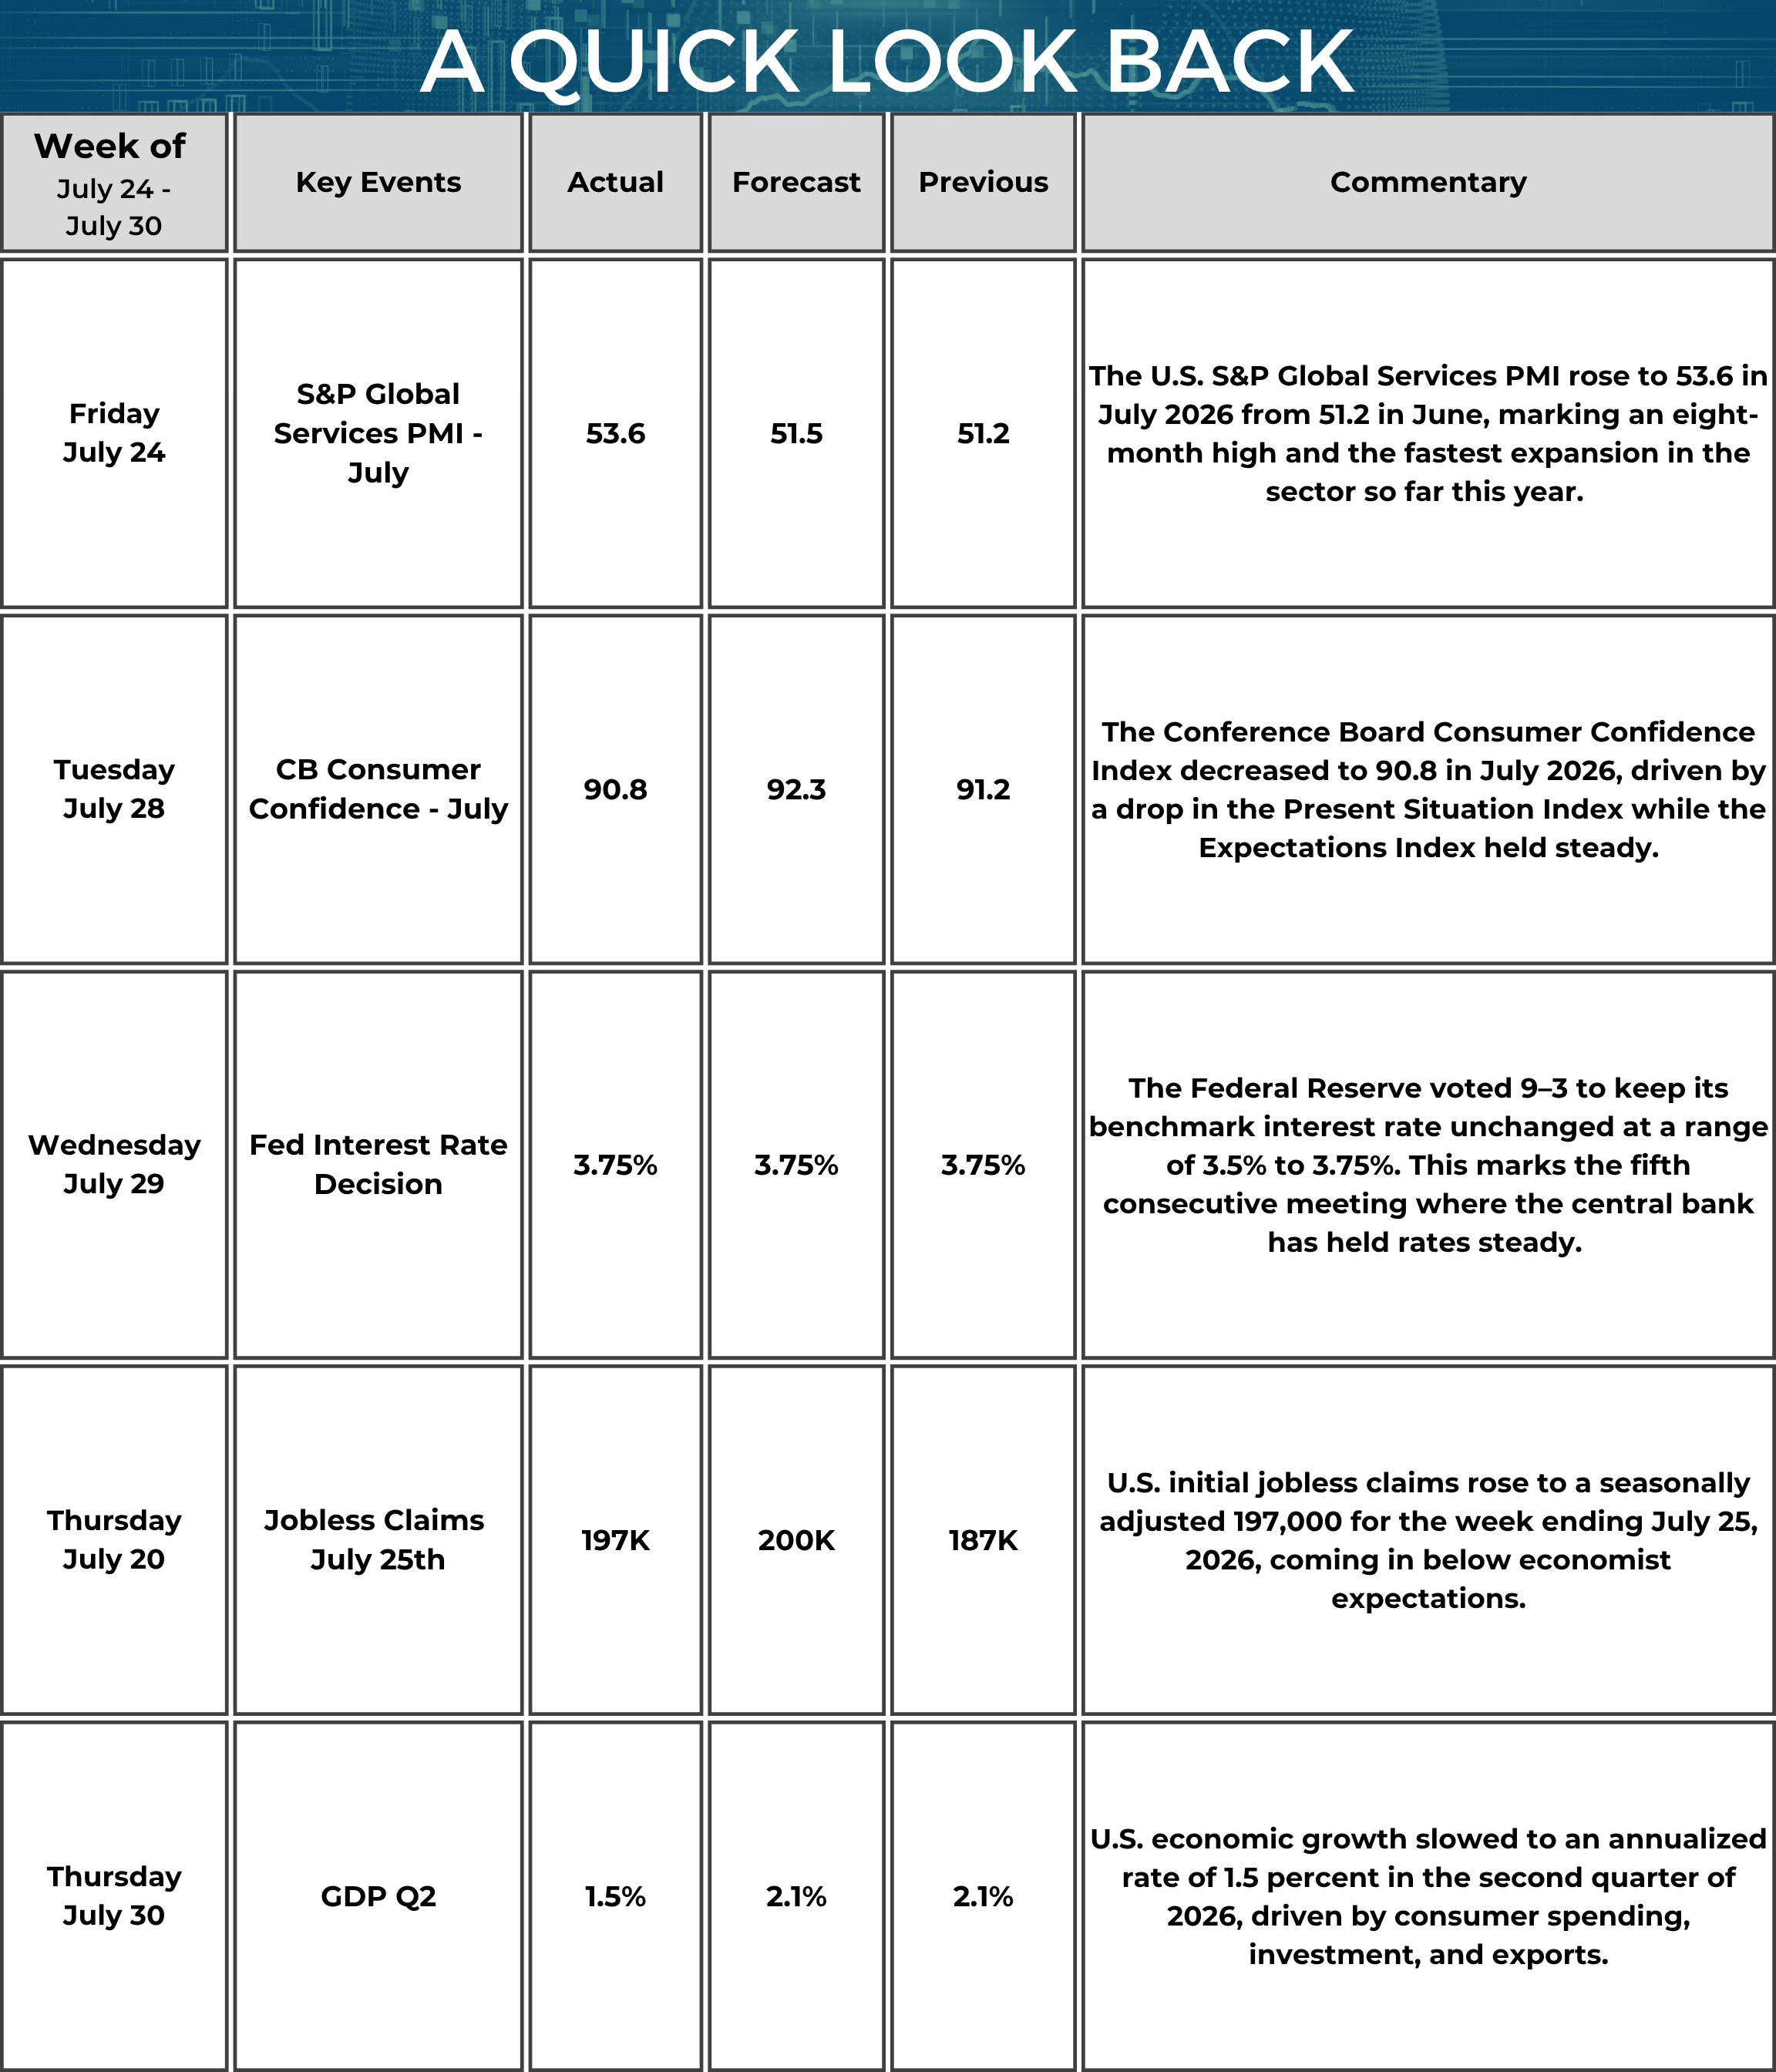
- Growing Fed Dissension: The Federal Reserve's July 29 rate hold was notably fractious. Three regional Fed presidents dissented, actively voting for a quarter-point rate hike due to sticky 4.1% PCE inflation. This internal division signaled to the bond market that further tightening remains a real possibility.
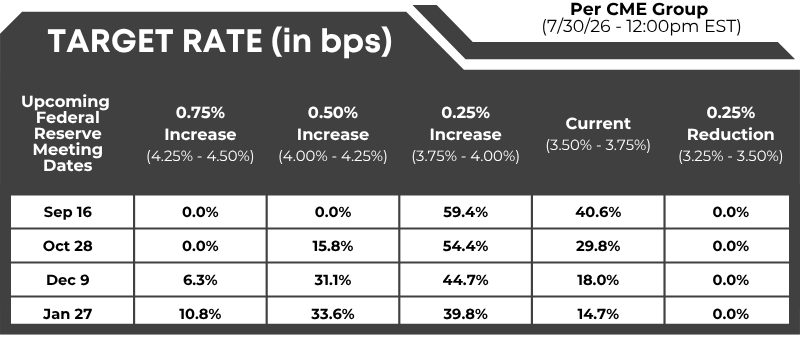
- The "Higher for Longer" Timeline: Following the Fed meeting, the CME FedWatch index showed a sharp increase in expectations for a September rate hike. The latest committee "dot plot" further solidified that the era of ultra-low rates has officially concluded.
- Shift in Loan Product Mix: As traditional purchase volume slumped, the market adapted. The Adjustable-Rate Mortgage (ARM) share of total applications ticked up to 8.1% as buyers aggressively sought lower initial introductory rates.
- Government Loan Drop: The application slowdown disproportionately hit more sensitive segments, showing prominent drops in Federal Housing Administration (FHA) and Department of Veterans Affairs (VA) loan submissions.
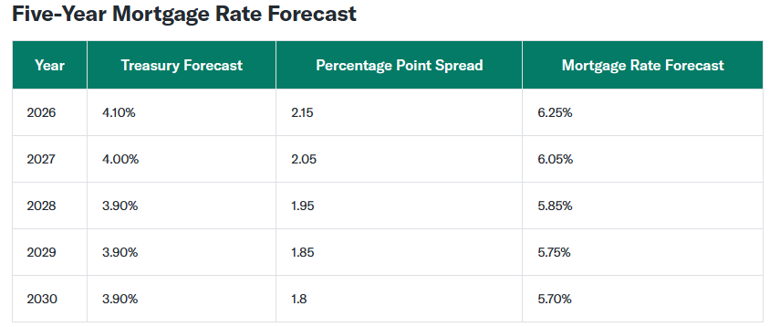
Mortgage rate predictions through 2030: Where are they headed?
Fed Watch: Target rate (in bps) possibilities, according to the CMEGroup (as of 07/30/2026– 12:00 PM EST):
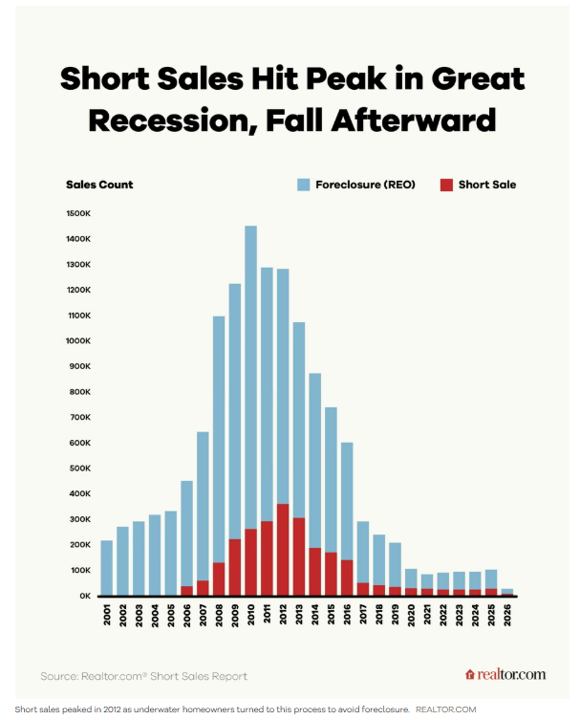
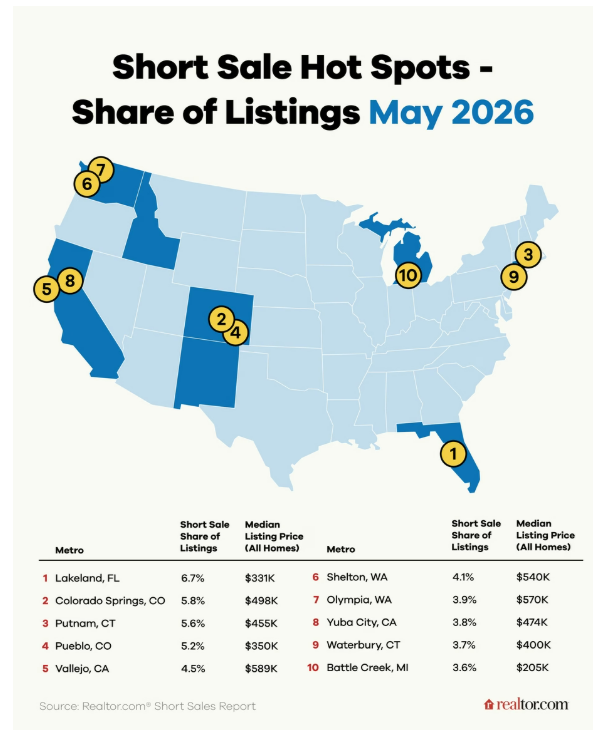
Short Sales Are Rising as Underwater Homeowners Try To Dodge Foreclosure
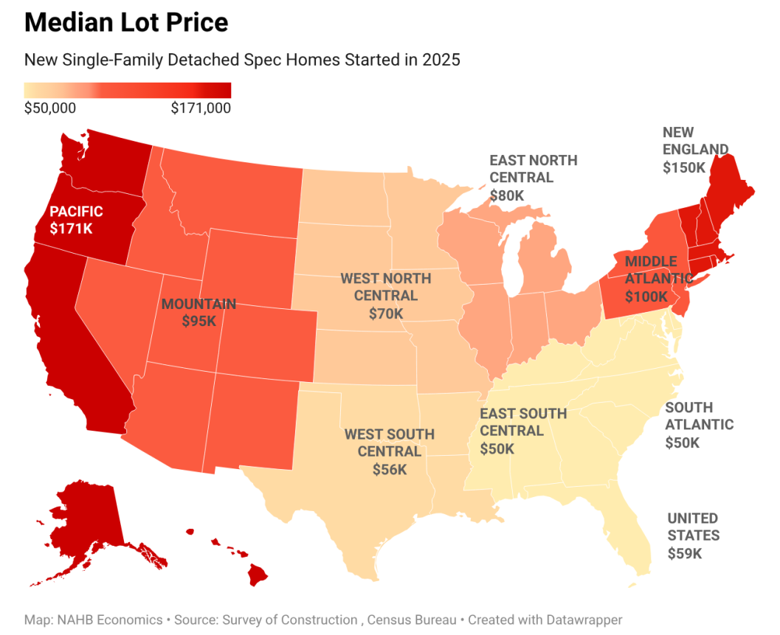
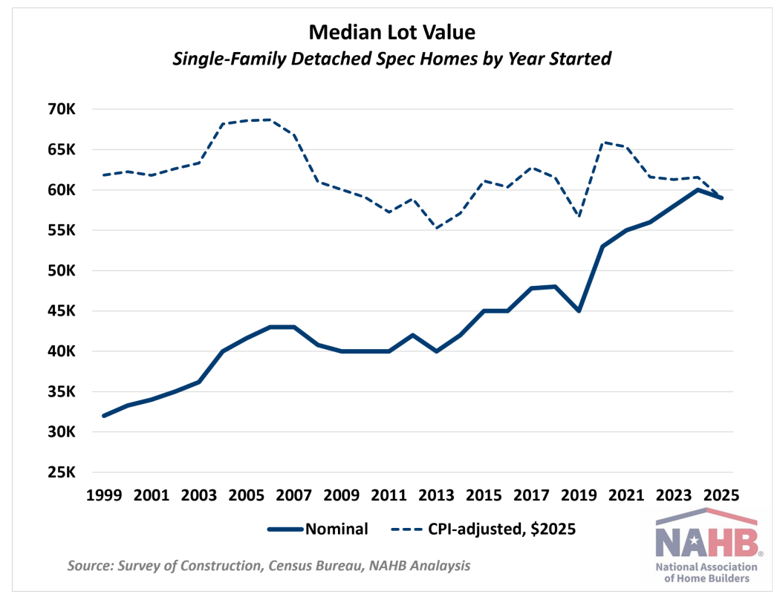
Median Lot Value Stabilizes as Regional Trends Diverge
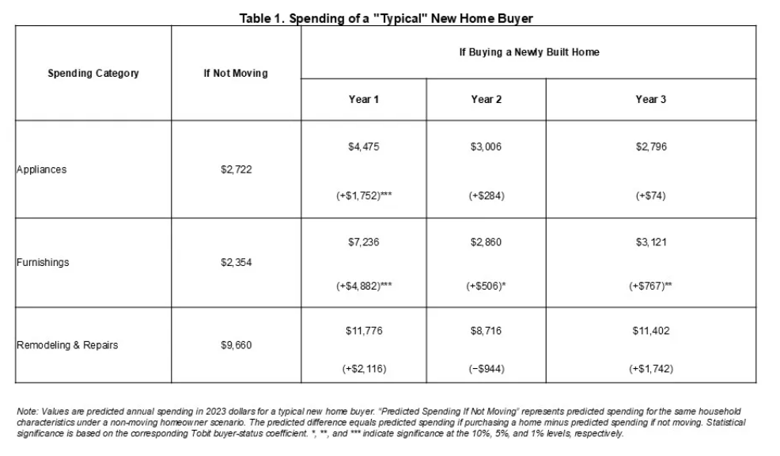
How a Home Purchase Boosts Consumer Spending

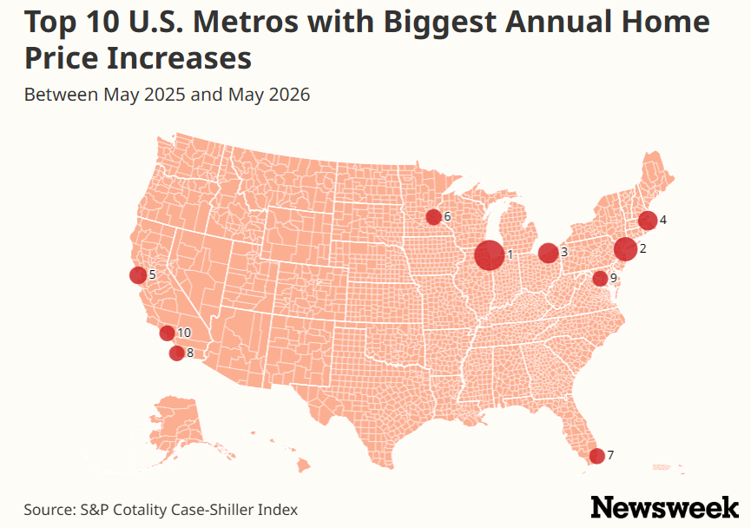
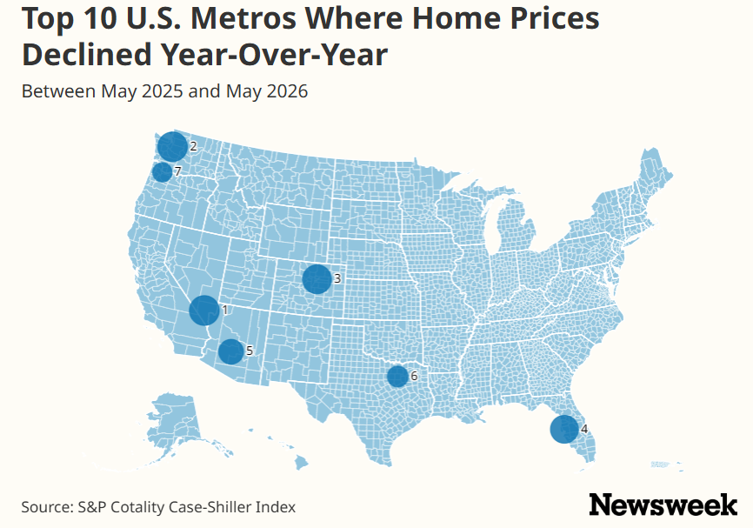
Map Shows Biggest Winners and Losers of America’s Housing Market Divide
Midyear Momentum
Since 1950, 17 times including this year, the S&P 500 has been up 5%-10% at midyear. The average return during the second half of the year has been 6.6% (better than the post-1949 average of 4.9%) and the median has been 5.7% (slightly below the post-1949 median of 6.3%). Moreover, only in 2007 and 2011 (12.5% of the time) were returns negative in the second half of the year. - Elliot Eisenberg, Economist
News You Can Use:
· Case-Shiller and FHFA reports agree: Home affordability deteriorated in May - Scotsman Guide
· Price gaps for starter homes underscore structural supply imbalances - Scotsman Guide
· U.S. housing market in concerning slowdown, Fitch warns - Scotsman Guide
· Why Red Tape Reform Is Key To Solving the Housing Shortage
· Fed rate decision July 2026: Divided Fed holds interest rates steady
· CaseShiller seasonally adjusted YoY housing prices change 1.6% versus 1.3% estimate
· Las Vegas home prices post largest drop in the nation
*Communication is intended for Industry Professionals only and not intended for Consumer Distribution
Interest rate and annual percentage rate (APR) are based on current market conditions as of 07/30/2026, are for informational purposes only, are subject to change without notice and may be subject to pricing add-ons related to property type, loan amount, loan-to-value, credit score and other variables. Estimated closing costs used in the APR calculation are assumed to be paid by the borrower at closing. If the closing costs are financed, the loan, APR and payment amounts will be higher. Contact us for details. Additional loan programs may be available. Accuracy is not guaranteed, and all products may not be available in all borrower's geographical areas and are based on their individual situation. This is not a credit decision or a commitment to lend. Actual interest rate, APR, and payment may vary based on the specific terms of the loan selected, verification of information, your credit history, the location and type of property, and other factors as determined by Prosperity Home Mortgage, LLC. Not available in all states. Rate is as of 07/30/2026 and is subject to change at any time without notice. Opinions, estimates, forecasts, and other views contained in this document are those of Freddie Mac’s economists and other researchers, do not necessarily represent the views of Freddie Mac or its management, and should not be construed as indicating Freddie Mac’s business prospects or expected results. Although the authors attempt to provide reliable, useful information, they do not guarantee that the information or other content in this document is accurate, current, or suitable for any particular purpose. All content is subject to change without notice. All content is provided on an “as is” basis, with no warranties of any kind whatsoever. Information from this document may be used with proper attribution.









.png)


.png)


